
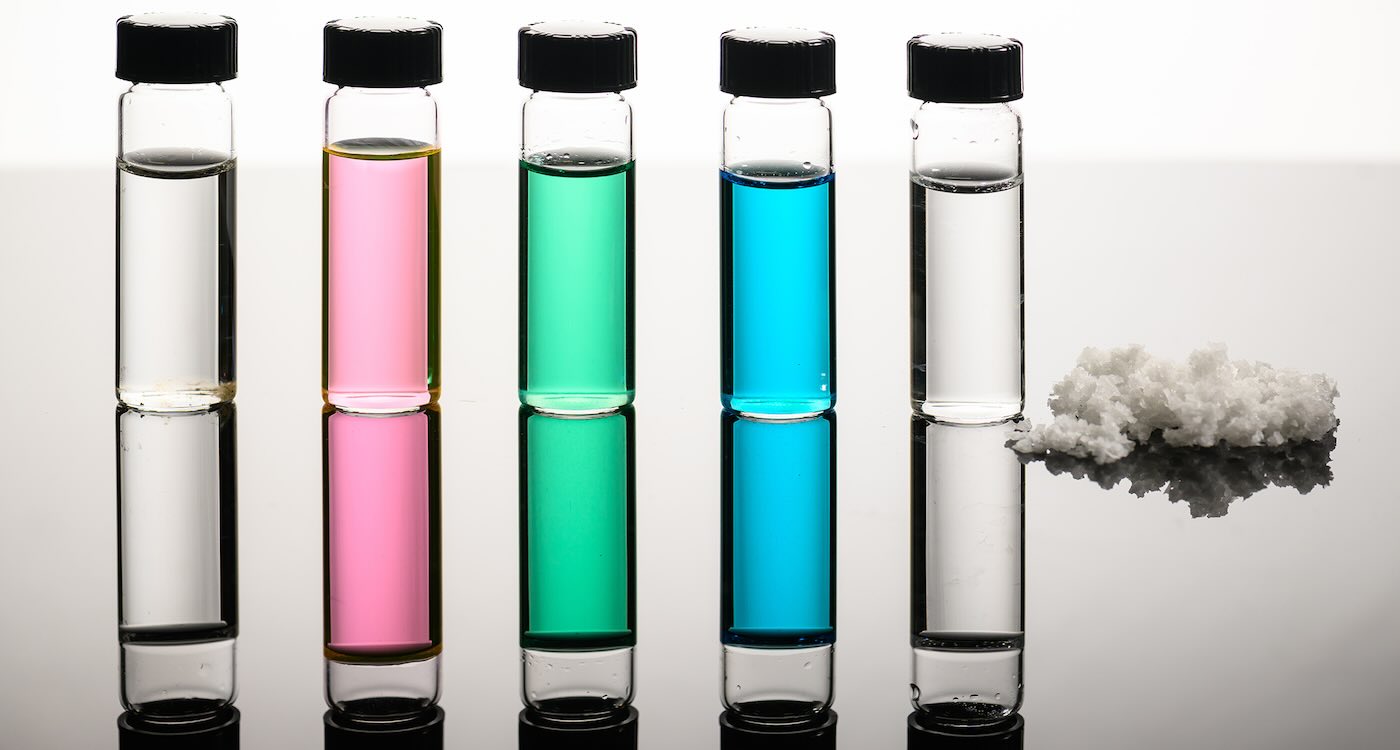
Vials of (left to right) seawater, salt water, nickel sulfate, copper chloride wastewater, and desalinated water with recovered salts – Credit: University of Rochester / J. Adam Fenster
A new energy-efficient desalination system produces fresh water without chemical additives and transforms leftover salts into useful materials.
Communities from California to the Middle East currently rely on desalination plants to convert ocean water to fresh water. But, common desalination techniques—such as reverse osmosis and thermal distillation—are energy-intensive, require chemical water treatment, and leave behind a concentrated saltwater byproduct called brine, which wreaks havoc on sea life if it’s deposited back into the ocean by raising the salt content and lowering oxygen levels.
Now, a novel approach developed at the University of Rochester offers a way to overcome these drawbacks. Their new solar-thermal desalination process does not leave behind brine and requires no chemical additives to pre-treat the water, according to the paper published in Light: Science & Applications.
The technology uses solar panels made of black metal etched with femtosecond lasers to make the surface super light-absorbing and super-wicking, extremely attractive to water.
The panels have a laser-treated active region that pulls a thin layer of water across the surface, absorbs nearly all solar radiation, distills the water, and deposits the leftover salts and minerals into the panel’s untreated sides, leaving the active region unclogged for continuous desalination.
A team led by senior scientist Chunlei Guo, a professor of optics and physics at the university, says other researchers have developed solar-thermal desalination techniques that only work well in lab experiments—using simulated seawater made of only water and sodium chloride. The real ocean is much more complex, and these systems tend to encounter problems when used in the field.
Unlike sodium chloride, many other components in seawater, such as magnesium- and calcium-based materials, crystallize in a crusty and non-porous fashion on the solar panel’s surface—and water can’t seep through anymore. This is the same phenomenon as your shower head clogging over time, except that seawater contains hundreds of times more salts than your tap water.
The ‘coffee ring effect’ makes it self-cleaning
To keep their solar panel surface from gumming up, Guo’s team etched the black metal’s grooves so the various salts and minerals in ocean water would simply slough off. They also leveraged a physical phenomenon java-lovers have encountered for centuries: the coffee ring effect.
“If you drop coffee on a surface, eventually the water evaporates, and there’s a ring left at the outer edge that is the concentrated coffee particles,” says Prof. Guo. “We use that same principle to advance the salts to the passive region.”
Testing their solar-thermal desalination technique using samples of water from the Pacific, Atlantic, and Indian Oceans, Guo and his team were able to make the surface self-cleaning.
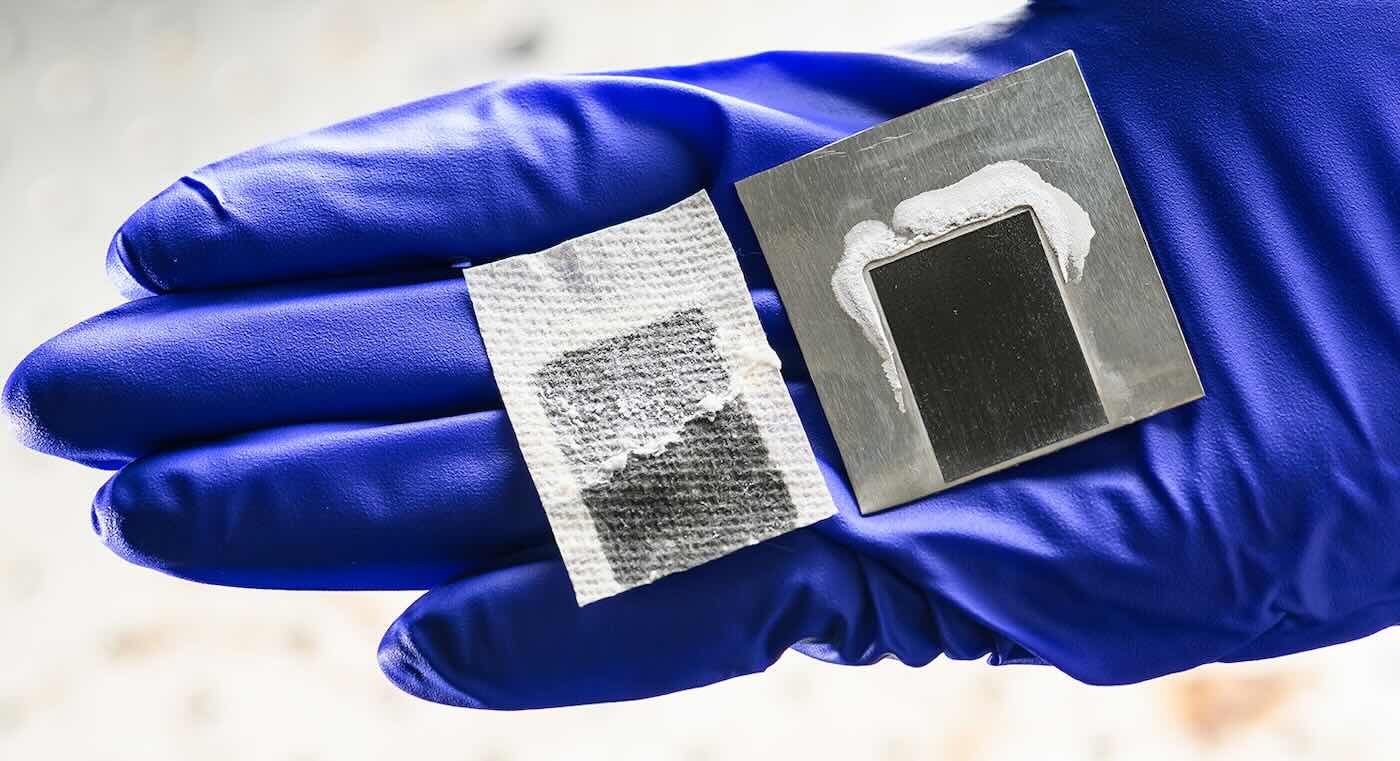
Old and new desalination systems – Credit University of Rochester / J. Adam Fenster
It extracted freshwater and directed the remaining salts to where they could be collected without reducing the panel’s efficiency.
Turning waste into resources – like lithium
Another distinct advantage is that instead of leaving behind brine that must be disposed of or processed, it extracts nearly 100 percent of the salts in solid form. This could not only produce an abundant supply of table salt, but it could also be used to extract more precious minerals, including lithium, which helps power electric vehicles and electronics.
“Mining lithium from the earth has proven to be very taxing from an energy and environmental standpoint, so pulling lithium directly from saltwater could be a very important future route,” says Guo.
In a related paper in the Journal of Materials Chemistry, Guo and his colleagues showed how they can use the same super-wicking solar panels to separate lithium from the rest of other salts in desalination.
Embedding nanoparticles made of hydrogen titanate in the tiny grooves of the black metal surface isolates the lithium from other salts and minerals.
Using water samples from Great Salt Lake, the researchers extracted about 50 percent of the lithium from the salts left behind by the desalination process.
Guo sees the technology as inherently scalable, capable of improving global access to drinking water while building a more sustainable supply of precious minerals.“Mining lithium from the earth has proven to be very taxing from an energy and environmental standpoint, so pulling lithium directly from saltwater could be a very important future route.” New Solar Method Turns Ocean Into Drinking Water, While Extracting Valuable Lithium Without Waste:
(The work was funded by the National Science Foundation, the Bill & Melinda Gates Foundation, and Worldwide Universities Network.)

 Fabiana Rizzi / Unsplash


 Lions call to announce their presence in the landscape and to defend territories. Ben JJ Walker / UNSW Sydney,


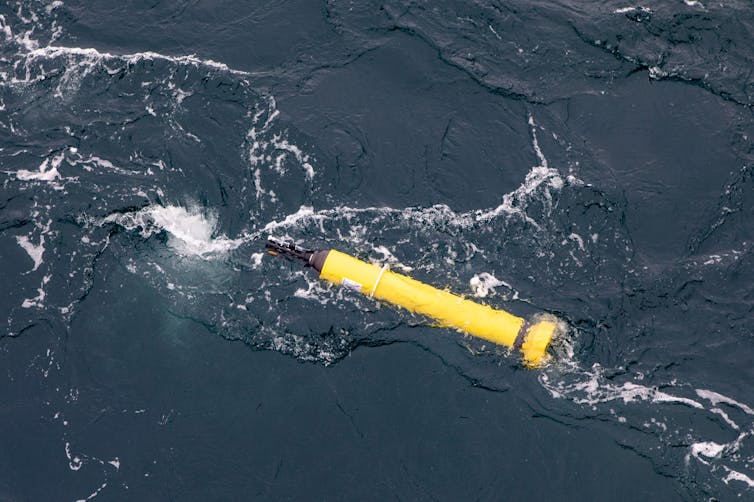 Argo floats are autonomous floats used in an international program to measure ocean conditions like temperature and salinity. Peter Harmsen,
