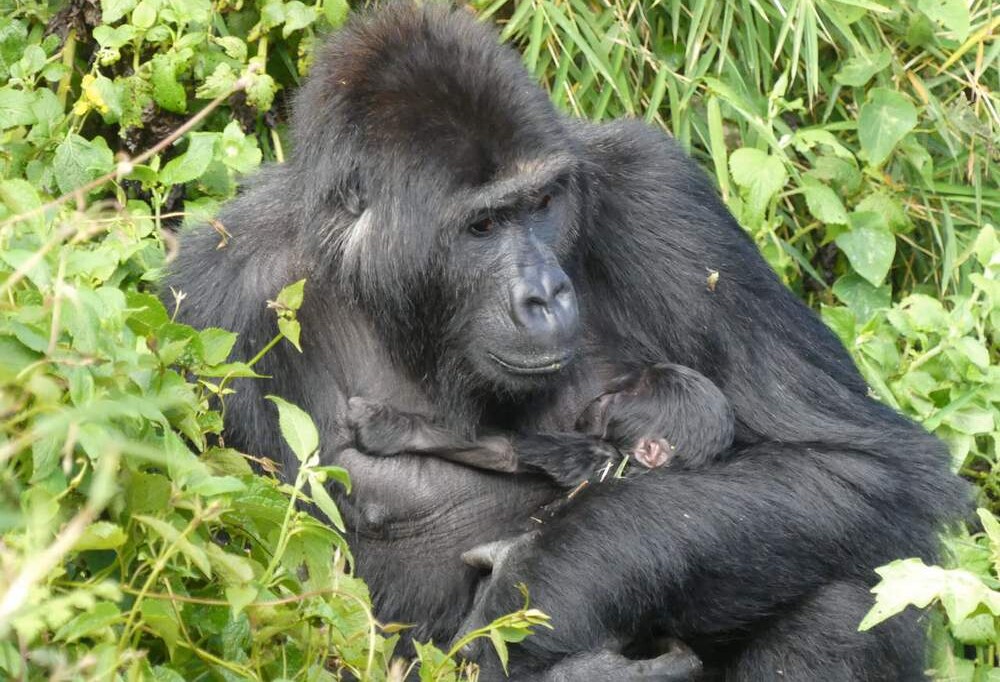
Lulingu and her infant – credit, Rewild, releasedOrphaned, Rescued, and Rewilded, Female Gorilla Becomes a Mother in Historic Conservation Success
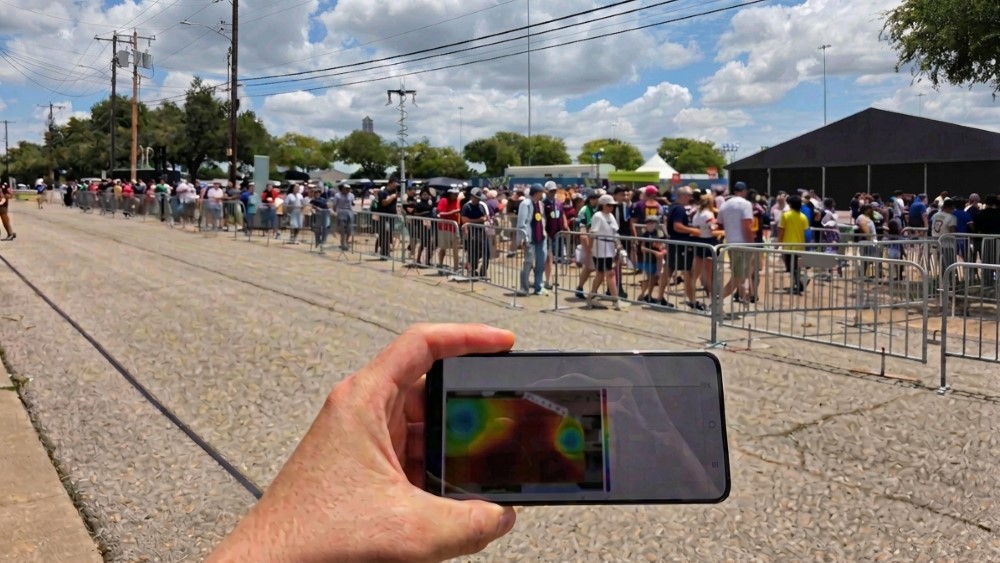
Lulingu and her infant – credit, Rewild, releasedSamsung and Verizon test ISAC capabilities in Dallas

Cataract Surgery Restores Sight for 54-Year-Old Chimpanzee–the First Such Procedure at Chimp Haven
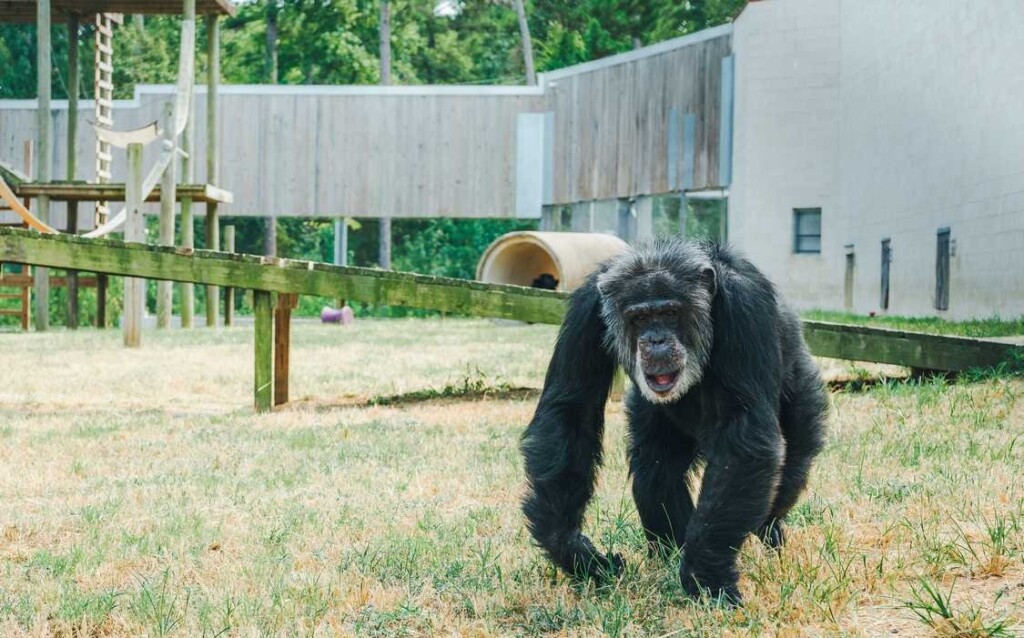
Pierre the Chimp recovering from cataract surgery – credit, Chimp Haven, supplied
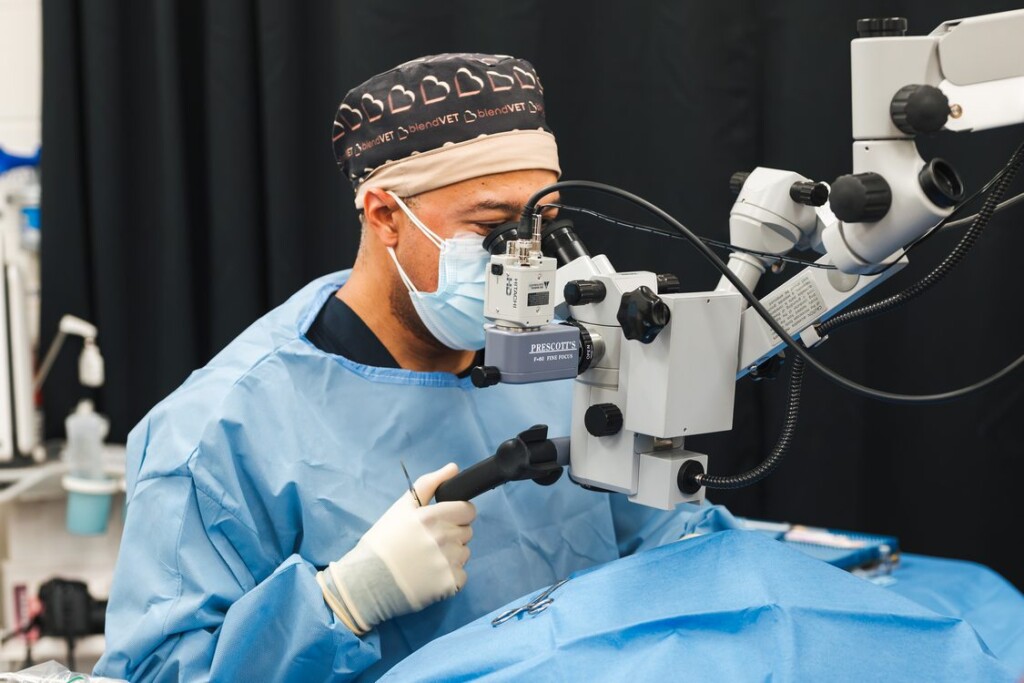
Scenes from Pierre’s surgery – credit, Chimp Haven, suppliedWant to be a citizen scientist? Here are 5 ways to get involved
Elodie Camprasse, CC BY-ND Ever wondered what it might feel like to spot giant spider crabs while you’re snorkelling? Or check plants for the circular holes that indicate native bees are collecting nest materials?
Citizen science relies on people like you – more than a million of them in Australia, actually – to collect and analyse valuable data about the world around us.
Here, we introduce five citizen science projects you can take part in. For most of them, all you need to get started is an app on your phone.

Science lives far beyond the lab, and it’s not just done by scientists.
In this series, we spotlight the world of citizen science – its benefits, discoveries and how you can participate.
Spider Crab Watch
Elodie Camprasse, Honorary Fellow – School of Life and Environmental Sciences – Deakin University
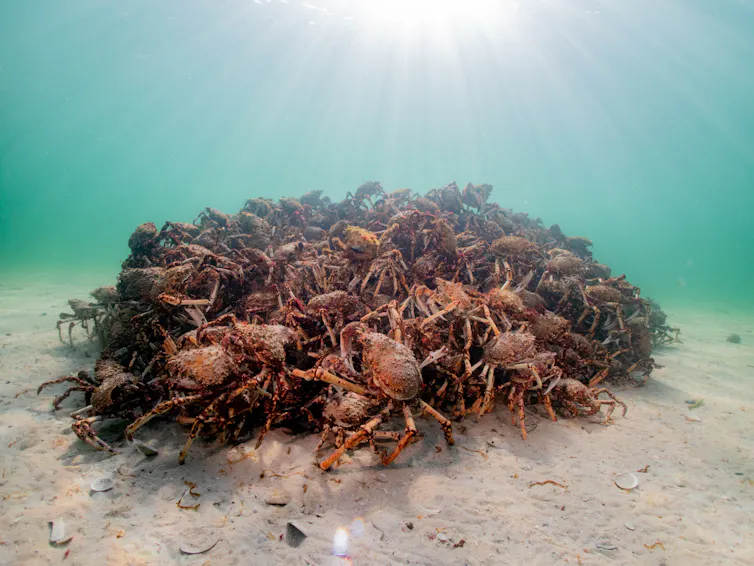
Every winter in Port Phillip Bay in Naarm/Melbourne, tens of thousands of great spider crabs gather in shallow water to moult – shedding their shells and growing new ones that grow to about 16 centimetres. But scientists know surprisingly little about them. The gatherings can be unpredictable and short-lived, making them difficult for scientists to monitor alone.
Spider Crab Watch helps researchers fill these knowledge gaps. By bringing together observations from the public – including divers, snorkellers and fishers – scientists can better understand when and where gatherings occur, how long they last, and what environmental conditions might trigger them.
Citizen scientists have already logged hundreds of observations, helping researchers identify new gathering sites and better understand when aggregations occur. Participants can log when and where they see spider crabs – whether a single crab or a large group, in Port Phillip Bay or elsewhere. Photos are helpful but not essential. Empty shells washed up on beaches can also be logged.
Gatherings of great spider crabs can be fleeting and in different locations. Elodie Camprasse, CC BY-NDNOBURN
Sam Van Holsbeeck, Research Fellow – Forest Research Institute – University of the Sunshine Coast
NOBURN (the National Bushfire Resilience Network) is a citizen science project aimed at improving our understanding of the role of vegetation in bushfire risk. Using an app, people around Australia can log their observations – including site photographs – to support research into fuel dynamics, fuel load and bushfire risk.
Guided by the app, participants assess vegetation at a site, noting factors such as shrub density and overall fuel hazard. Observations typically take 10–15 minutes and can be conducted by community members, landholders, students or land managers. To date, we have collected 154 verified site observations and more than 160 registered users.
Observations supplied by citizen scientists help researchers understand the structure, density and dryness of forest fuels. Combined with AI, this data allows for better prediction of the likelihood and severity of fires. While this data is not as detailed as a full expert assessment, they provide useful indicative information, particularly in areas where formal fuel monitoring is limited.
FrogID
Jodi Rowley, Curator – Amphibian & Reptile Conservation Biology – Australian Museum – UNSW Sydney
Australia’s frogs are in trouble. At least four species have been lost and dozens more are on the edge of extinction. Yet we lack the information needed to make informed decisions about how to conserve them. Frogs are very sensitive to environmental change. This makes them great indicators of environmental change (they’re often referred to as the “canary in the coal mine”). By monitoring them, we also gain insight into environmental health.
FrogID taps the keen eyes and ears of people across Australia to gather the data needed to help save Australia’s frogs.
Using our free app, people can record frogs wherever they hear them. The best time is after rain and in the first few hours after dark. Once submitted, Australian Museum frog experts listen to the recordings and identify species.
There are more than 100,000 registered users of FrogID who have together gathered almost 1.5 million records of frogs from across Australia. It’s safe to say this dataset has revolutionised our understanding of frogs in Australia – including finding 13 frog species new to science.
1 Million Turtles
James Van Dyke, Associate Professor in Biomedical Sciences – La Trobe University
Freshwater turtle numbers have fallen 60–90% across most of the rivers and wetlands of Australia, amid engineered flows and increasingly dry conditions. As turtles disappear, they leave a large gap. Turtles are the “vacuum cleaners” of the waterways, eating decaying organisms and vegetation and improving water quality.
The 1 Million Turtles project aims to increase survival rates of freshwater turtles and turtle nests, and increase Australia’s turtle population by at least one million animals.
People of all ages can download and record any turtles or turtle nests they see in Australia. They can also volunteer for other activities, such as nest protection, via our website.
To date, our citizen scientists have logged nearly 34,000 turtle records across the country. They have also saved more than 2,600 turtles from dangerous road crossings, and protected more than 1,940 turtle nests from invasive foxes and pigs.
Assuming each nest held an average of 15 eggs, and half of the turtles saved on roads were adult females of reproductive age, our program has given 400,000 turtles the chance of a future in just the past five years.
Data from this community conservation program has led to the conservation status of turtle species being upgraded to threatened or endangered. It has also prompted the development of state conservation programs for turtles in New South Wales, Victoria and South Australia.
Australian ‘leafcutter’ bees
Kit Prendergast, Research Fellow – School of Science – University of Southern Queensland
Native bee numbers are declining and we have limited information about them. There are more than 2,000 species of native bee, including the Megachile bee. Some species of Megachile bee use plant leaves or even petals to build their nests, giving them the common name of leafcutter bees.
We don’t yet know which plants these bee species rely on. This citizen science project allows the public to use an app to identify which plants the bees are relying on. By noting preferred plants, we’ll have a better idea of how to create habitats for these gorgeous native bees and pollinators.
Most native bees cannot be identified by citizens, due to the specialised skills required, and most diagnostic features being microscopic. But when it comes to plants, these are much better known among the public and can be identified easily by photos.
Members of the public can download the free iNaturalist app and when they see a plant that has distinctive discs cut out, or see a Megachile bee in action, they can take a photo of the leaf “damage”. Once completed, gardeners, land managers and farmers will be able to access an evidence-based list of which nesting plants should accompany food plants.
![]()
Miki Perkins, Environment & Energy Editor, The Conversation
This article is republished from The Conversation under a Creative Commons license. Read the original article.
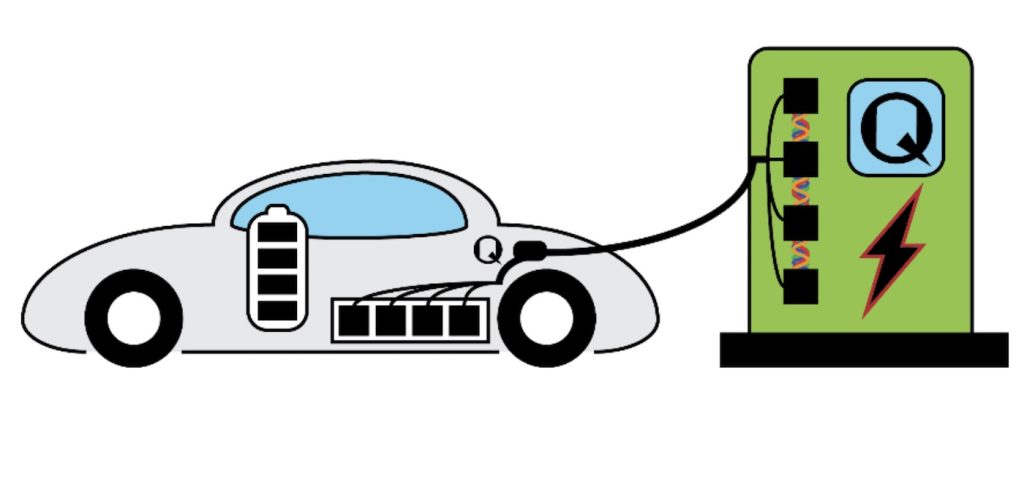
EV Charging Answer: Quantum Technology Will Cut Time it Takes to Charge Electric Cars to Just 9 Seconds
Institute for Basic ScienceHimalayan hazards are becoming more complex. Our warning systems need to catch up
Mehebub Sahana, University of Manchester; Nimesh Dhungana, University of Manchester; Priyank Pravin Patel, Presidency University, Kolkata, and Reshma Shrestha, Kathmandu University
The exact timeline of the recent Nepal flooding disaster is becoming clearer. At 8:37am, instruments recorded what was initially interpreted as an earthquake near Nepal’s border with China. Seven minutes later, CCTV recorded the Gyirong Port border post being destroyed by a massive debris flow and flood.
Nepal’s flood authorities learned about the incident at about 9:00am and sent out an emergency SMS alert at about 9:15am. But by that time, Nepal was already deep into a major disaster.
The 38 minute gap between the tremor being detected and the emergency alert is striking. But it would be wrong to assume Nepal’s authorities could simply have acted on the initial signal: at the time, it appeared to be a small earthquake, rather than a much rarer mountain collapse. The flood also arrived too swiftly for water-level sensors: they went almost immediately from recording normal levels to being destroyed.
The more interesting question is what a better-integrated warning system might have made possible. Could seismic readings, satellite images and other observations have been combined quickly enough to recognise what was happening and alert people further downstream?
Existing early-warning systems have often been designed around particular hazards such as regular rain-caused floods or glacial lake outburst floods (Glofs). But this disaster was neither a Glof nor a regular flood. Instead it appears to have involved a rare, large-scale collapse of rock and ice, which turned into a devastating debris flow and flood.
As a recent study of a strikingly similar flood in India last year argued, this type of hazard is largely absent from existing warning frameworks. As warming destabilises glaciers and thaws permafrost, such events are likely to happen more often.
Cascading mountain hazards that cross borders
In July 2025, a glacial lake in Tibet burst and swept down this very same stretch of river into Nepal, killing at least nine people and leaving around 20 missing in Nepal. Eleven people were also officially reported missing on the Chinese side.
After the flood, Nepal and China agreed in principle to share real-time information about floods, landslides and glacial lakes. However, despite Nepal’s foreign minister raising the issue during a visit to China in May 2026, no formal agreement has been signed.
Across the Himalayas and Hindu Kush mountain ranges, rivers, weather systems and infrastructure frequently span national boundaries. Our ongoing research shows a hazard that begins in one place can have lethal consequences – and create new warning requirements – far downstream.
A warming climate is increasing these risks by thinning glaciers, thawing permafrost and destabilising slopes, even if climate change isn’t the sole explanation for every disaster. Meanwhile roads and hydropower projects are putting more people and infrastructure in threatened valleys.
Cooperation has to come before the disaster
Some cross-border early-warning arrangements already exist between Nepal and its neighbours, particularly for recurring floods. But sudden, cascading events such as the recent disaster pose a different challenge. A warning has value only if it travels the whole distance – from a sensor in the mountains, through scientific agencies, national and local authorities, to households in the valleys and plains below, in the minutes that matter.
Community-based flood warning already works in parts of Nepal’s Koshi basin, where upstream gauges and trained local volunteers buy downstream villages precious time. A regional early warning system would have to link these community-level systems with national and cross-border monitoring, so that information can move from the source of a hazard to the people at risk. That means agreeing in advance what should be shared, how warnings should be passed between countries and agencies, and what action they should trigger.
That requires institutional changes and political commitment, as much as new technology. The region’s existing water treaties were written to divide flows and manage dams and barrages, not to govern cascading hazards in the high mountains. Governments could establish permanent bodies responsible for Himalayan rivers and their associated hazards. Featuring both scientists and policymakers, and linked to counterparts in neighbouring countries, these public bodies would be mandated to share data, jointly monitor glaciers, lakes and slopes, and coordinate warnings across borders.
The aim would be to make cooperation routine and sustained between disasters, rather than improvised in a crisis when events may unfold too quickly for international debate. None of this requires neighbours to resolve their wider disputes; it asks only that disaster warning be ring-fenced as shared humanitarian infrastructure that keeps working unabated.
The technologies for predicting and monitoring high-mountain hazards are improving fast. We now need more international scientific and policy cooperation, and warning systems capable of turning these observations into rapid action.![]()
Mehebub Sahana, Senior Research Fellow and Lecturer in Environmental Management, University of Manchester; Nimesh Dhungana, Lecturer in Disasters and Global Health, Humanitarian and Conflict Response Institute, University of Manchester; Priyank Pravin Patel, Assistant Professor, Department of Geography, Presidency University, Kolkata, and Reshma Shrestha, Associate Professor, Department of Geomatics Engineering, Kathmandu University
This article is republished from The Conversation under a Creative Commons license. Read the original article.
Indian scientists develop new sensor-connected devices to prevent ammonia gas exposure
Data centres have existed for decades. So why are they so controversial now?
Until recently, data centres attracted relatively little public attention. They were largely treated as invisible pieces of digital infrastructure: essential but rarely discussed outside technical and industry circles.
But over the past 12 months across Australia, data centres have become the subject of intense political debate, community opposition, planning disputes and parliamentary inquiries.
Questions are being raised about how much electricity and water they use, where they should be built, who should pay for the infrastructure needed to support them, and whether Australia benefits from their continued expansion.
These questions are feeding into government policy. Following Prime Minister Anthony Albanese’s speech at the University of Sydney in July, a National Cabinet meeting in August reaffirmed plans to legislate nationally consistent mandatory standards for large data centres by early next year. These will include requirements around their energy, water and land use.
So how did a piece of digital infrastructure that once attracted relatively little public attention become such a prominent policy issue? Data centres themselves are not new. What has changed is their scale, purpose and the resources required to support their growth.
Data centres have existed for decades. But something has changed, and this essential infrastructure is now at the centre of a major policy debate.
This article is part of The Conversation’s series on data centres – what they are, why we need them, and why they’re suddenly so controversial.
The evolution of data centres
Data centres are specialised physical facilities that house servers, networking equipment and data storage systems. They are foundational infrastructure for the modern digital economy, supporting a wide range of services such as streaming, social media, banking, emergency response systems, and artificial intelligence (AI).
The origins of data centres can be traced to the 1940s, when early computers were so large they needed dedicated spaces to house them. As computers became smaller, more powerful and more accessible, governments and businesses increasingly adopted their own IT infrastructure. They often operated on-premises server rooms to manage email, file storage and other internal systems.
The internet then drove a shift towards larger co-location data centres in the 1990s, where multiple customers could rent space for their servers in a single shared facility.
Then came cloud computing. This provided customers with on-demand access to computing resources over the internet, and further accelerated the growth of data centres. In 2006, Google opened its first hyperscale data centre. Amazon Web Services also launched its first cloud computing services in the same year. Cloud service providers subsequently built increasingly large facilities to meet growing demand for these services.
What was once a room or floor serving a single organisation evolved into massive dedicated facilities – often called hyperscale data centres – capable of supporting millions of users. Today, the scale of a data centre is often measured by its power capacity, in megawatts or gigawatts. This reflects how much electricity the facility can draw at any one time.
Australia’s data centre boom
Australia’s own data centre market reflects this shift in scale.
Australia currently has over 160 operational data centres, with most located in New South Wales and Victoria. There are at least another 90 facilities in the development pipeline.
The data centres now being proposed are also considerably larger than many existing data centres.
For example, the proposed 1.2 gigawatt Mamre Road Data Centre in Sydney would cover an area equivalent to the size of 52 rugby fields.
If built to its maximum capacity, it would become Australia’s largest single electricity user.
Why AI is driving bigger data centres
Hyperscale data centres typically contain at least 5,000 servers, occupy at least 10,000 square feet of physical space, and can draw over 100 megawatts of power. That’s enough to meet the annual electricity needs of more than 50,000 households.
In 2025, hyperscale operators accounted for 48% of global data centre capacity.
Cloud computing and the growth of everyday digital activity initially drove the expansion of these large, centralised facilities. But since OpenAI launched ChatGPT in late 2022, AI has rapidly accelerated this growth.
AI workloads are far more computationally intensive than traditional digital services. They are expected to account for approximately 70% of data centre demand by 2030.
Training advanced AI models requires dense arrangements of specialised chips working simultaneously to process large volumes of data. This can run continuously for weeks or months.
Once trained, AI models also require computing power to respond to users. This process is known as inference. While a single interaction requires considerably less computing power than training a model, that demand adds up across millions of users.
Inference represents an increasing share of AI’s energy demands. This will continue to increase alongside AI adoption.
A 2025 survey found 88% of organisations reported regularly using AI in at least one business function – an increase from 78% a year earlier.
The shift toward large-scale data centres is also about efficiency.
Larger facilities tend to be more efficient. They benefit from economies of scale and advances in facility design, such as optimising power distribution and using higher-performance chips and servers.
In Australia, on-premises servers are estimated to consume over seven times more electricity to perform the same computation as hyperscale and co-location data centres.
But while hyperscale data centres can use energy more efficiently for the computing they perform, the sheer scale and growth of demand mean their overall electricity consumption is still significant.
Data centres accounted for around 3% of electricity supplied through Australia’s main grid in 2025–26. This share is projected to reach 13% by 2035–36.
What comes next for Australia?
The growth of Australia’s data centre market is unlikely to slow anytime soon.
Australia remains a competitive destination for data centre investment, with strong government support, continued interest from major technology companies and an estimated A$150 billion in data centre buildouts by 2030.
But community opposition is emerging as a significant risk for new developments. This opposition is, in part, because of the land, power and water data centres consume.
But it’s also because there is uncertainty over whether the significant investment in AI infrastructure will truly generate sufficient economic returns – and who will benefit from those returns.
The future growth of Australia’s data centre sector may therefore depend less on whether there is demand or capital to build them, and more on where they can be built, who bears the costs, and whether communities benefit from hosting them.![]()
Johanna Lim, Research Associate, Strategic Technologies, University of Sydney
This article is republished from The Conversation under a Creative Commons license. Read the original article.
Can you upload a human mind into a computer? A neuroscientist ponders what’s possible

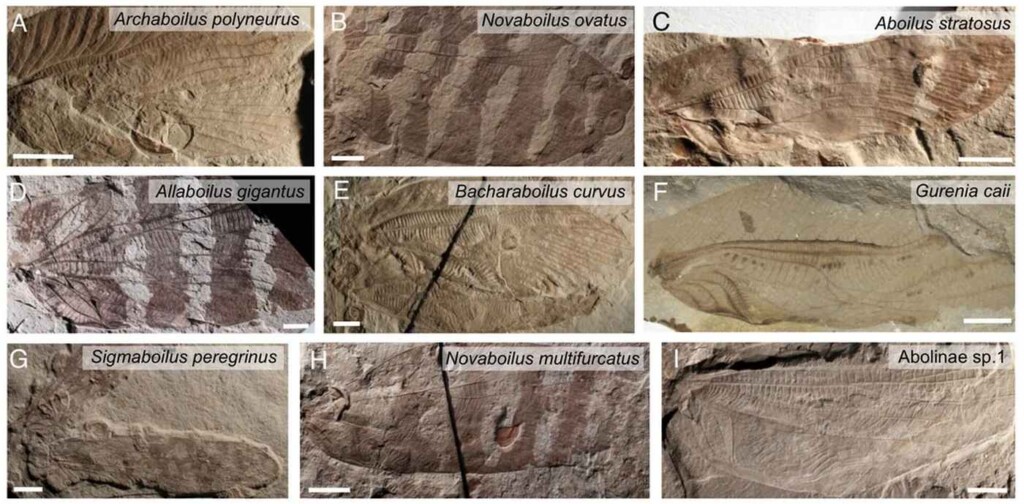
Scientists Recreated Chirps of Jurassic Insects, Simulating a 165 Million-yo Soundscape (Listen)

The evolution of science and technology: How humanity evolved with it?
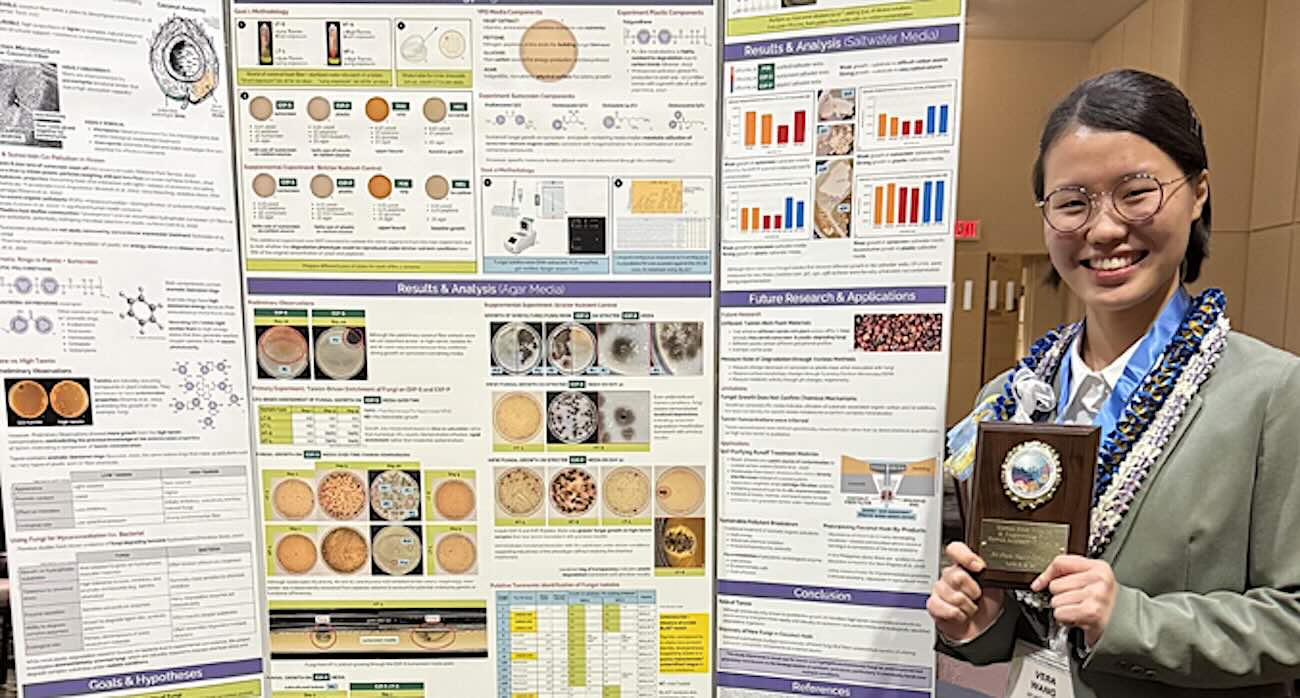
Teen Discovers Coconut Fungi Can Filter Plastic and Sunscreen From Sea—And Wins Science Fair
Coconut fungi experiment by Vera Wang wins awards at 2026 Hawaii State Science and Engineering Fair – Released by SOEST
Kauai in Hawaii by Karsten WinegearSurvey Finds Blackbirds to Have the Most Beautiful Songs in the Avian World–Science Explains Why

- 1. Common Blackbird (4.52 average pleasantness score)
- 2. Willow Warbler (4.45)
- 3. Blackcap (4.43)
- 4. Mistle Thrush (4.33)
- 5. Garden Warbler (4.30)
- 6. Dunnock (4.30)
- 7. Chaffinch (4.29)
- 8. Common Nightingale (4.26)
- 9. Common Linnet (4.26)
- 10. European Goldfinch (4.26)
- 11. European Pied Flycatcher (4.25)
- 12. Eurasian Wren (4.24)
- 13. Skylark (4.23)
- 14. Eurasian Golden Oriole (4.17)
- 15. Common Cuckoo (4.13)
- 16. Tree Pipit (4.08)
- 17. Common Redstart (4.08)
- 18. European Greenfinch (4.08)
- 19. Eurasian Treecreeper (4.05)
- 20. European Robin (4.04)